Import Your Products
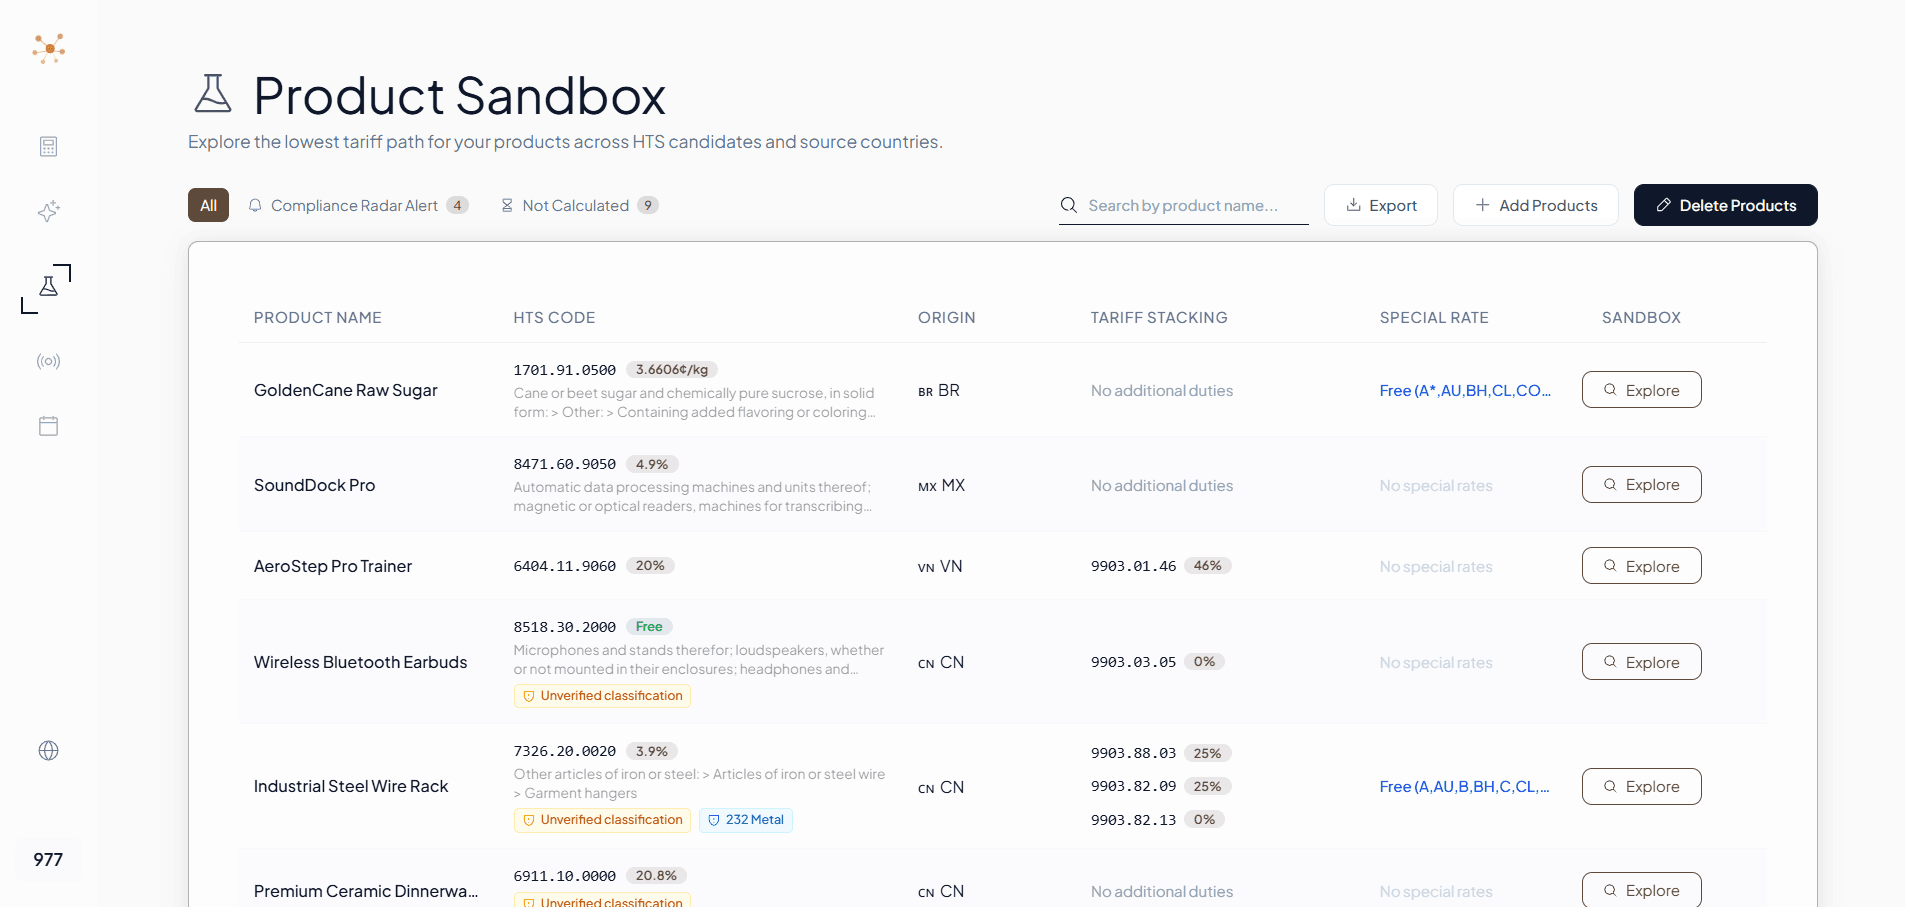
Add products one at a time or bulk import an Excel or CSV catalog. HTS candidates from your Classifier research carry over automatically.
Product
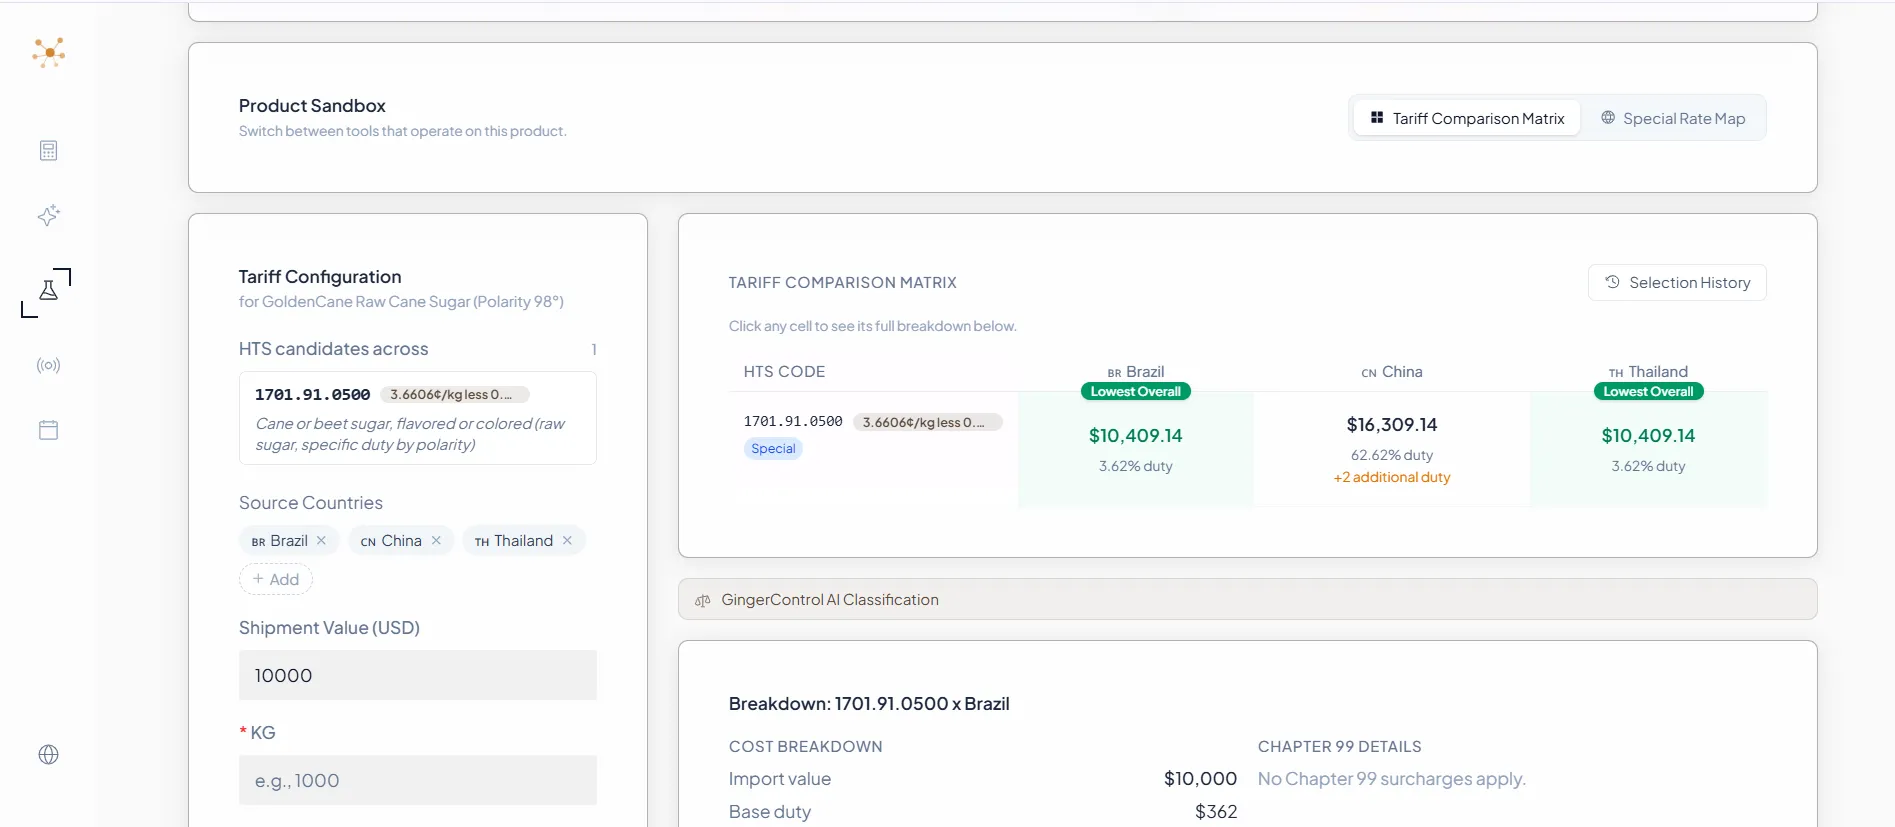
Retire the multi-tab Excel of HTS codes, countries, and landed costs. Product Sandbox compares N products against M source countries in one matrix, highlights the lowest landed cost automatically, quantifies FTA savings in dollars, and keeps a timestamped Selection History of every committed decision.
Add products one at a time or bulk import an Excel or CSV catalog. HTS candidates from your Classifier research carry over automatically.
Set shipment value, entry date, freight terms, and source countries once, then apply them to every product in the workspace.
The matrix highlights the lowest landed cost in each row and across the workspace. Drill into any cell, then save the decision to Selection History.
01 / Per-Product View
Landed cost for every product across every selected country in one grid, with row-best and global-best cells highlighted in green and recalculated against today's tariff schedules. No more five browser tabs of USITC lookups.
02 / Workspace
Every product under analysis on one page. The Radar Alert tab flags SKUs hit by a policy change, the Not Calculated tab catches missing configurations, and the Special Rate column previews FTA eligibility before you open the matrix.
03 / Audit Trail
Every committed decision is written to a timestamped record: HTS candidate, country, configuration, and the duty stack at the time. When you need to revisit why a combination was chosen, the full context is one click away.
04 / FTA Savings
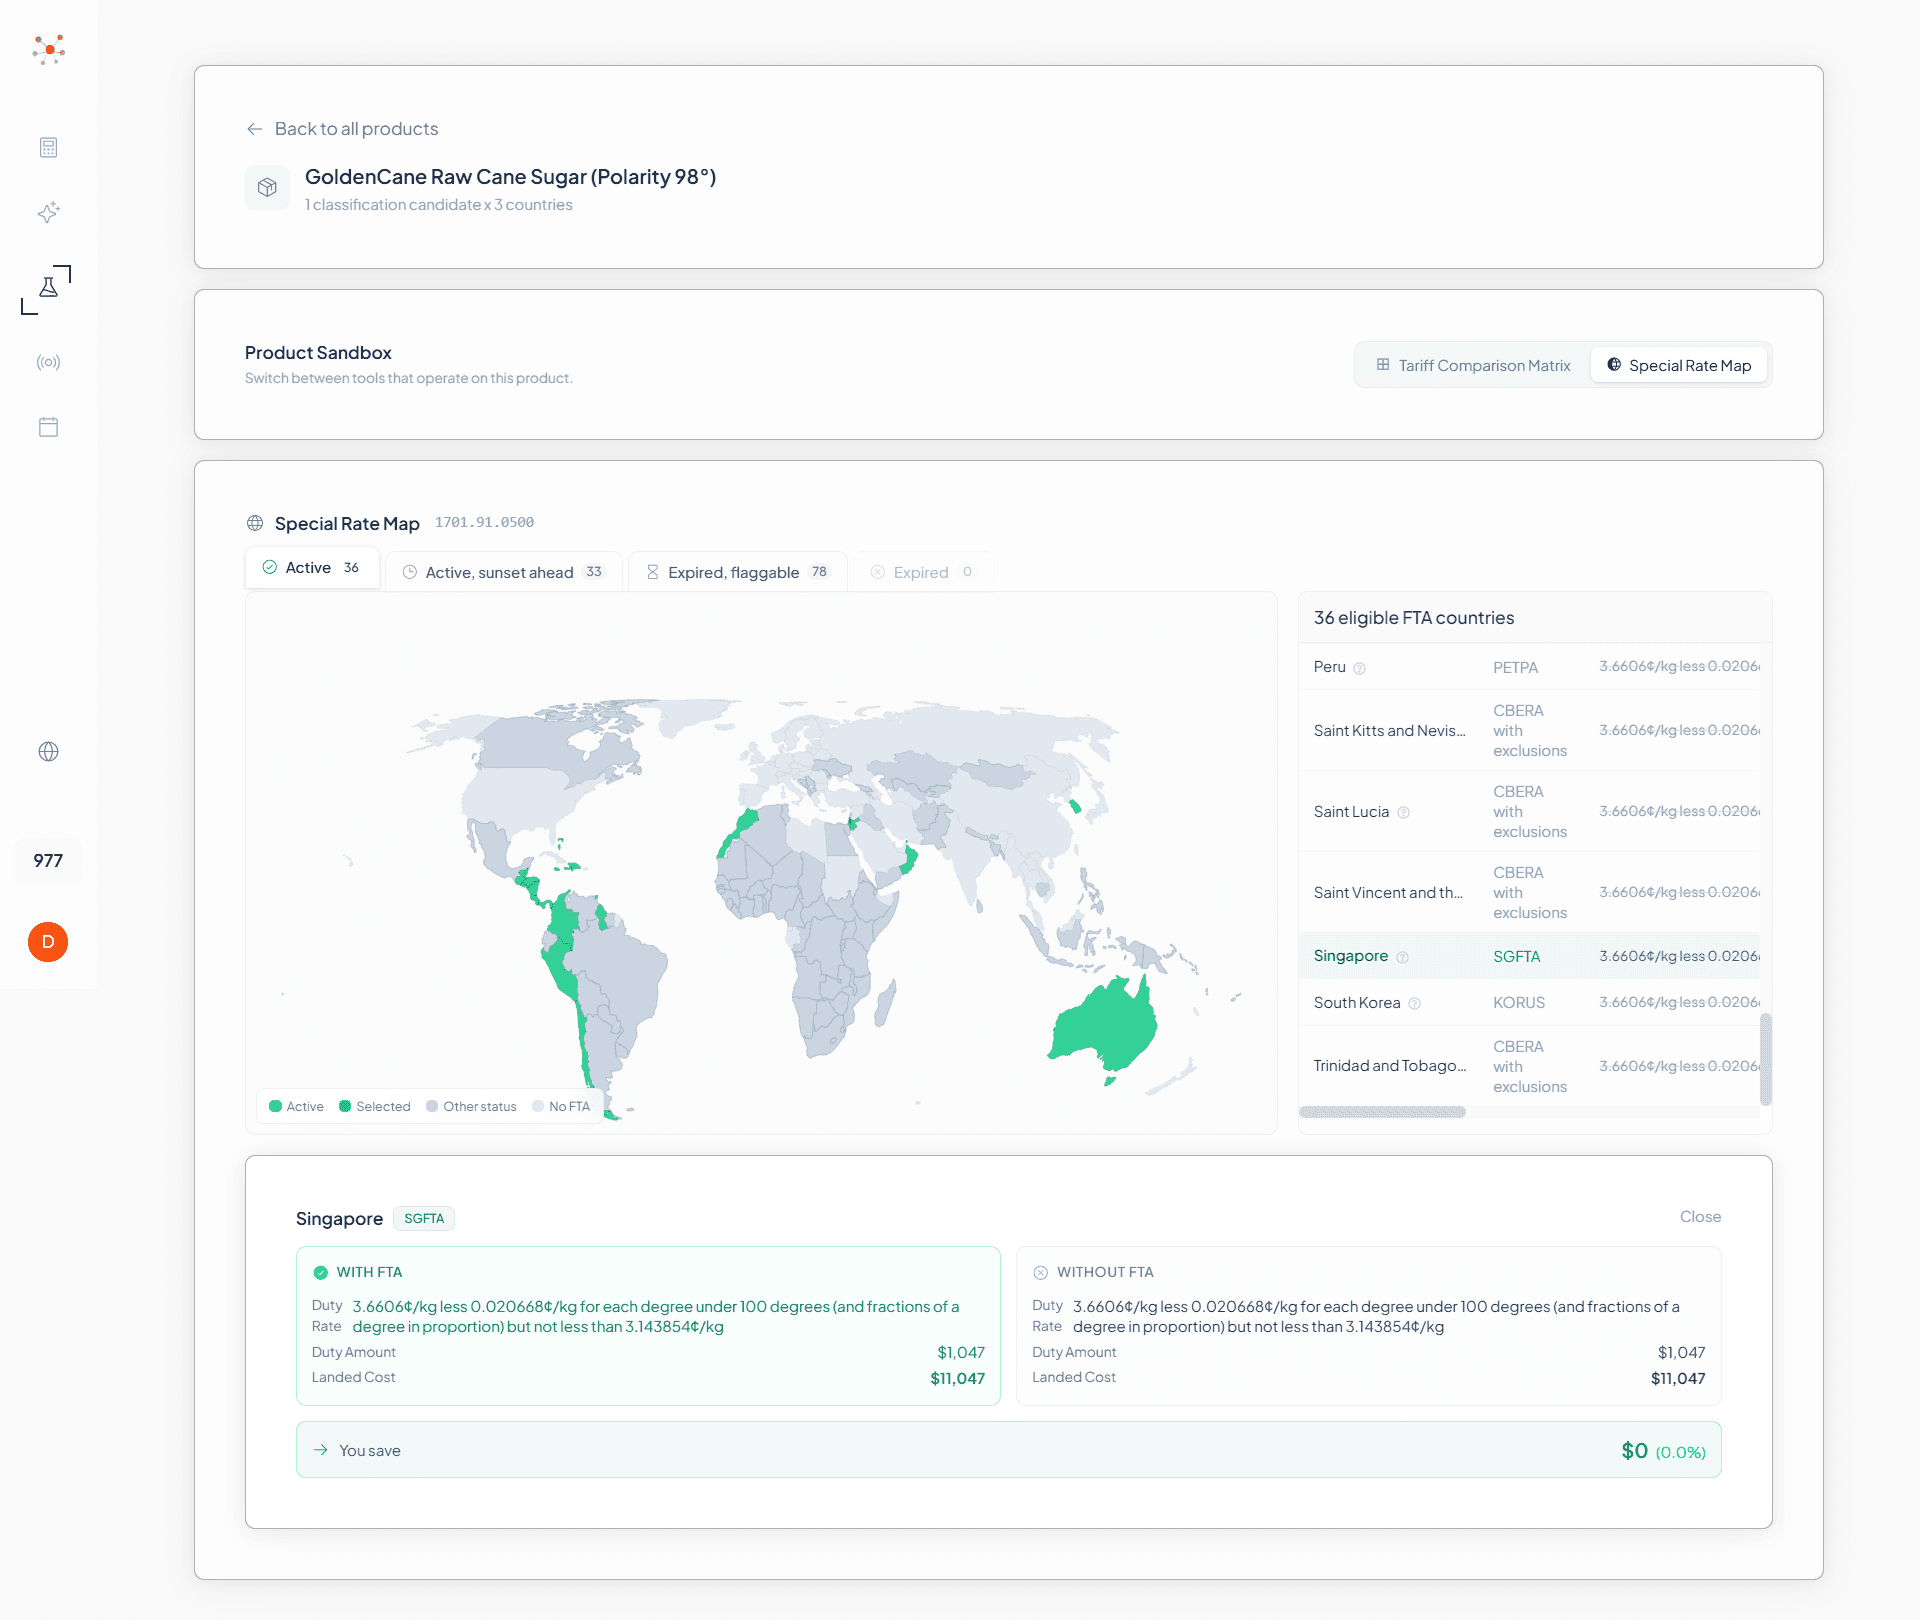
The FTA Compare Drawer shows the exact dollar delta between an FTA preference and the MFN rate. The Special Rate Map color codes every country by Active, Expired, or Pending FTA status.
The decision surface where you compare every product against every country in one canvas.
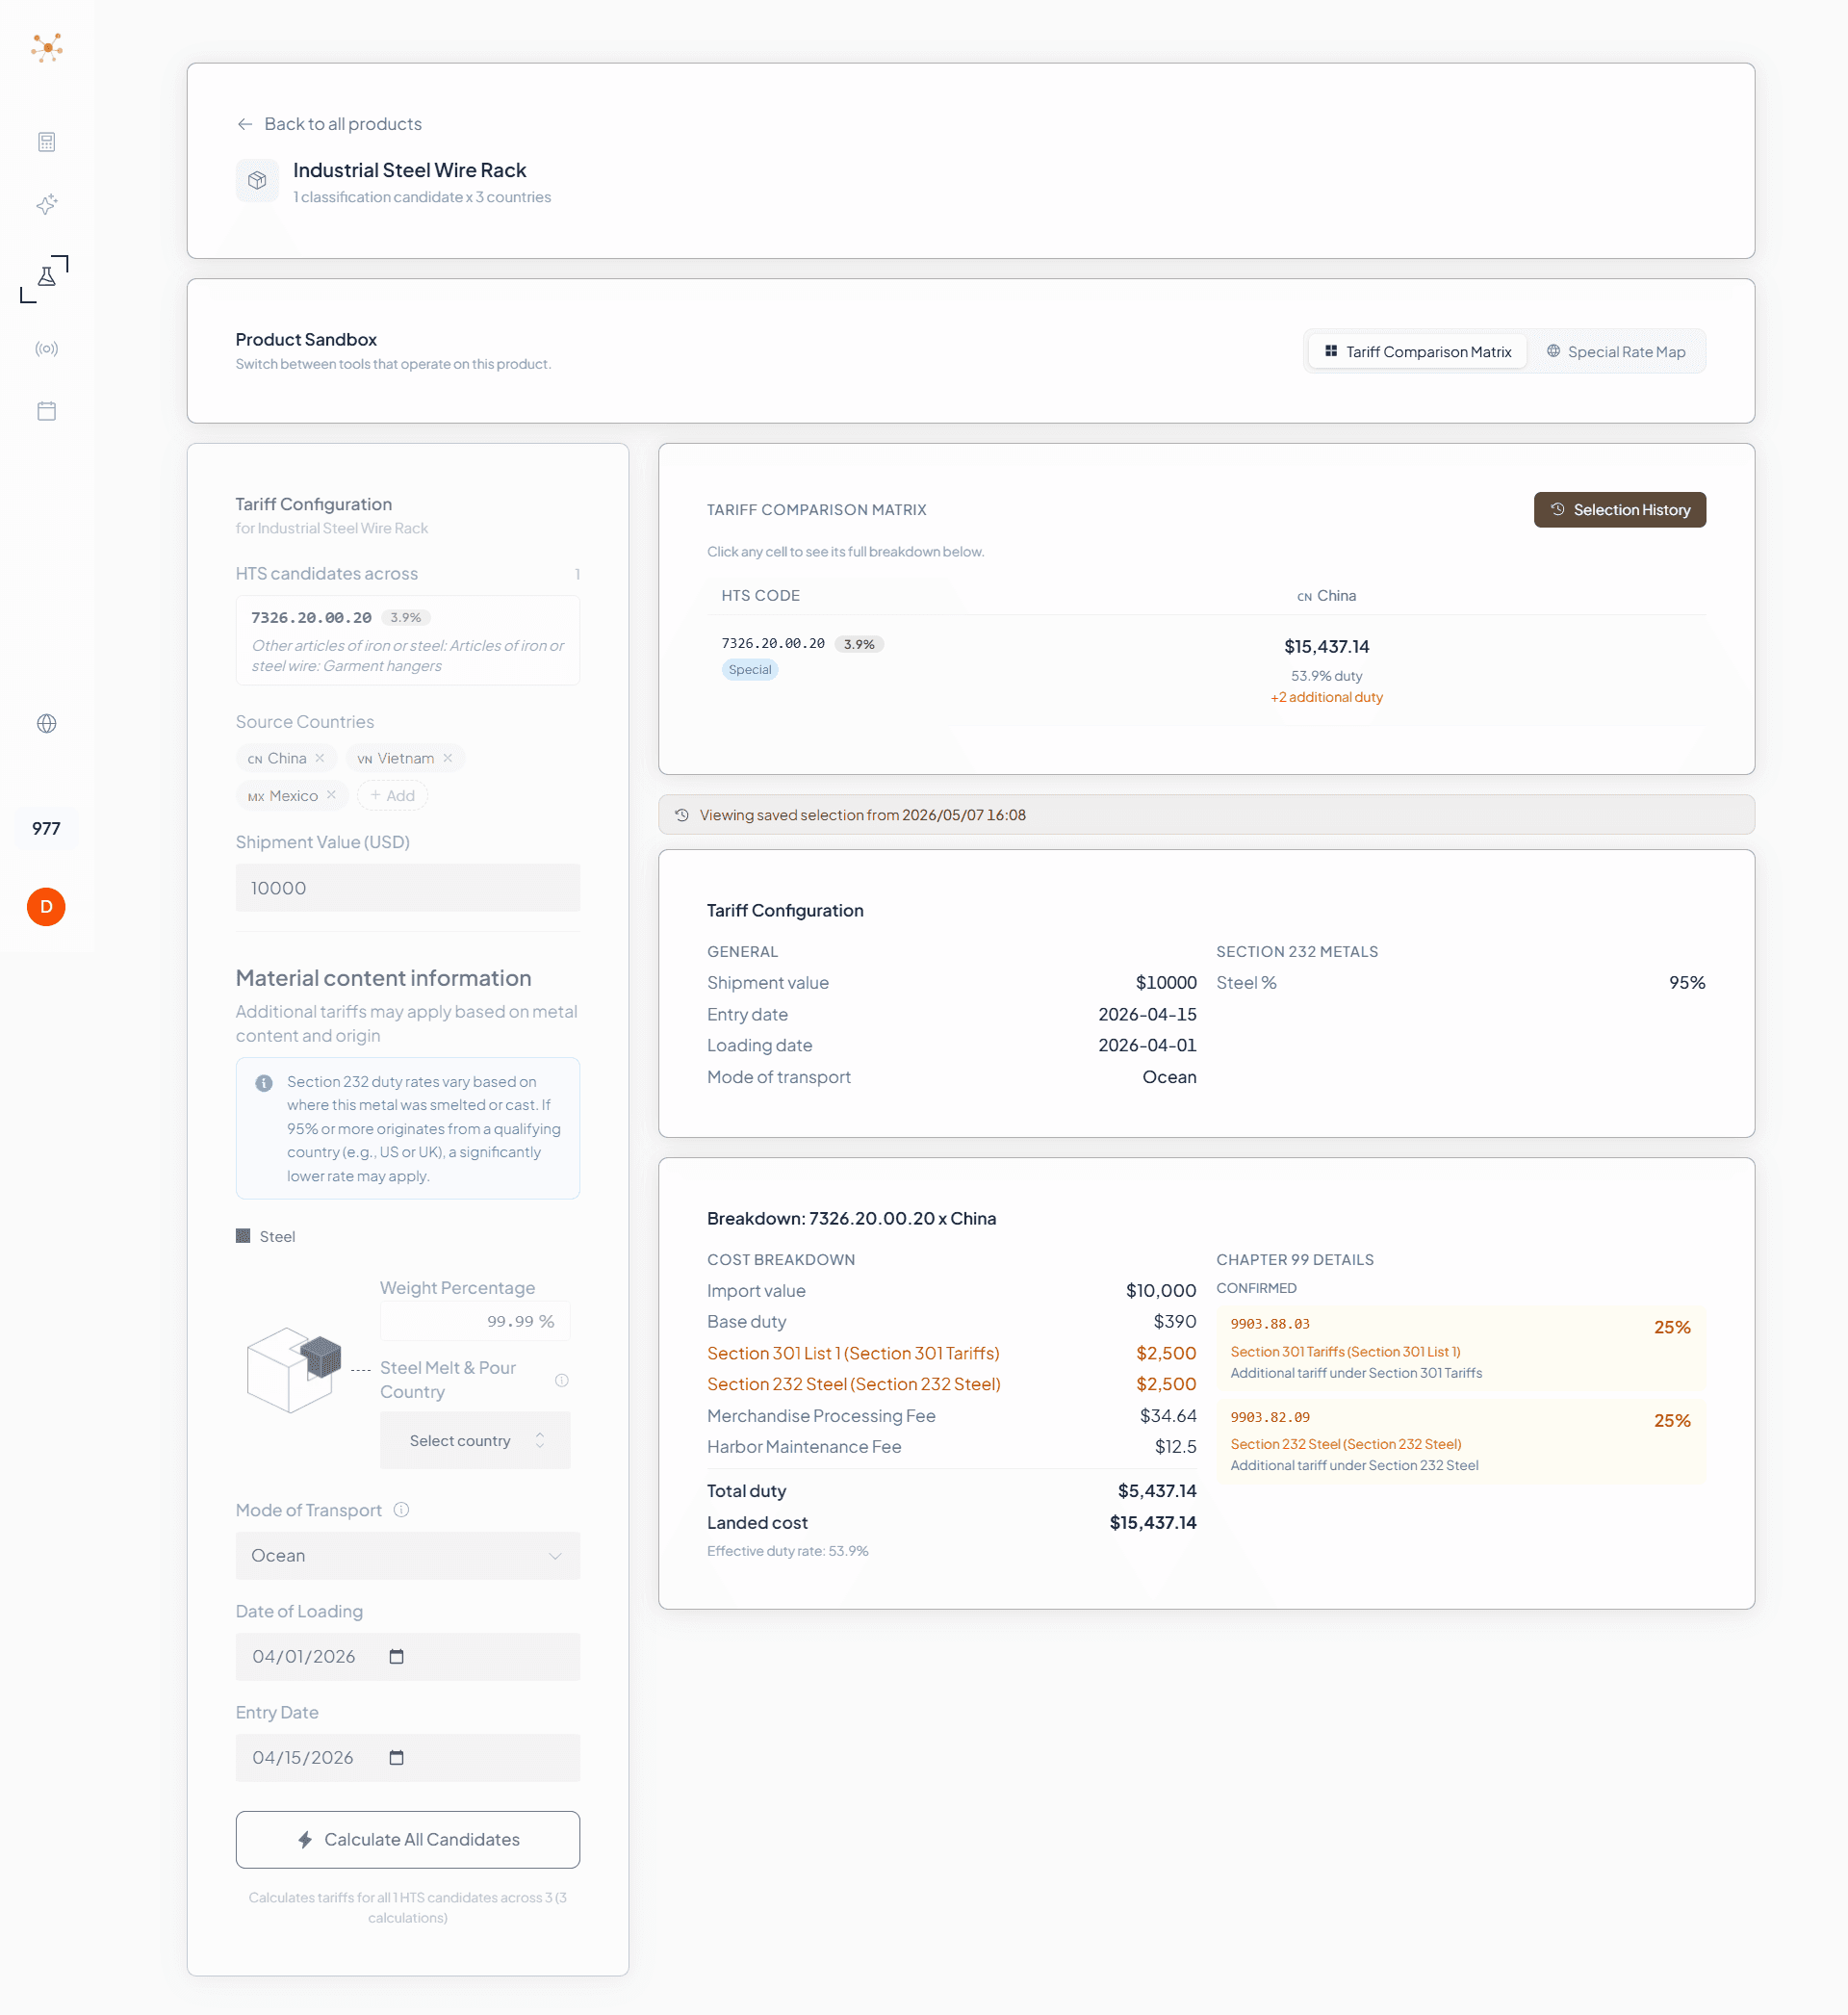
Every product (rows) against every selected source country (columns) in one view. Row-best and global-best cells are highlighted automatically. Click any cell to expand the full duty stack: MFN base rate, Section 301, Section 232, Section 122, Chapter 99 surcharges, MPF, and HMF.
Keep a complete record of every classification you committed to.
Every committed selection writes the HTS, country, configuration, and full tariff calculation to a timestamped history. 19 CFR 163.4 requires importers to retain classification records for five years, and Selection History builds that record automatically as you work.
From a single SKU to a thousand-product catalog, without losing the decision log.
Upload an Excel or CSV of up to thousands of SKUs in one shot. Use the interactive world map to add source countries by region, with countries shaded by FTA status (Active / Expired / Pending). Save favorite country sets so you never reselect the same group twice.
Product Sandbox is built for teams that own product-line sourcing decisions and need a clear record of why each choice was made.
Compare landed cost across alternative source countries before reshuffling suppliers
Quantify the dollar impact of moving SKUs from one origin to another
Build board-ready sourcing recommendations with documented assumptions
Keep a timestamped record of every classification and country selection
Model duty cost scenarios across multiple sourcing strategies for budget planning
Run pre-entry FTA eligibility checks for client portfolios in one workspace
"When a new Section 301 list lands on a Friday afternoon, I need to know by Monday morning which of my SKUs are affected, what each one will cost to land if I shift sourcing to an alternate country, whether I can claim FTA preference on the new origin, and when a CF 28 inquiry shows up eighteen months later, I need to be able to explain why I chose what I chose."
| Find the affected SKUs in minutes, not days | The matrix loads every product against every selected country at once. You see the shape of the impact at a glance, then drill in. |
|---|---|
| Quantify the dollar delta before recommending a move | Any cell expands to the full duty stack, and the FTA Compare Drawer shows exactly what the preference saves per shipment. |
| Explain the decision eighteen months later, when someone asks | Selection History holds the timestamped record of what was chosen, under which configuration, and why. |
Open the Sandbox and build your first N x M matrix in minutes. Every decision you commit is on the record when someone asks why.
For general reference only. See compliance disclaimer.
Compliance Reminder
This is an HTS classification researcher. Results are for general reference, educational, and planning purposes only, designed to enable better communication between trade compliance teams, importers, and licensed customs brokers. Per CBP Ruling HQ H290535, providing HTS classifications beyond 6 digits for specific imports constitutes "customs business" under 19 U.S.C. § 1641. Do not use these results directly in customs entry documents without independent review by a licensed customs broker.
Read full compliance disclaimer →We use cookies to understand how visitors interact with our site. No personal data is shared with advertisers.